Aviation Area Winds (AAW) is a text product that provides forecast winds at levels 1000, 3000, 5000, 7000 and 10,000 ft, and forecast temperatures for 5000, 7000 and 10,000 ft for each of 17 AAW areas in NZ.
AAW are for preflight use and are available from:
PreFlight(external link)
MetJet(external link)
IFIS(external link)
The 17 AAW areas are depicted on this map:
An example is shown in the GRAFOR User Guide(external link).
AIREP (a routine air report), AIREP Special (or ARS, a special air report), and PIREP (pilot report) are reports provided from an aircraft in flight.
An AIREP is a routine report of meteorological conditions made from an aircraft in flight, while an AIREP Special is provided when hazardous meteorological conditions are encountered.
A PIREP is similar to an AIREP Special and is an abbreviated AIREP Special provided by domestic operators in New Zealand whenever weather phenomena of significance or of a hazardous nature are encountered.
AIREP, AIREP Special and PIREP are for use in-flight and are available from:
UAPS61 NZKL 041950Z
(ARS-NZM742-NZDN-NZCH-AT76
-BIDEL
-1943
-F155
-MOD ICING)
| Code | Decode |
| UAPS61 NZKL 041943Z | Message header (UAPS61), originating centre of the message (NZKL – Wellington Meteorological Office) and the date-time when the message was disseminated (1943 UTC on the 4th of the month). |
| ARS-NZM742-NZDN-NZCH-AT76 | ARS: message type AIREP SPECIAL NZM742: aircraft identification (airline code and flight number) NZDN-NZCH: Route (Dunedin to Christchurch) AT76: Type of aircraft (ATR 72-600) |
| BIDEL | Location of observation: At waypoint BIDEL |
| 1943 | The time of observation: 1943 UTC |
| F155 | Height at which the phenomena was observed: Flight Level 155 |
| MOD ICING | Phenomena observed: Moderate icing |
Automatic Terminal Information Service (ATIS) reports are aerodrome take-off and landing reports provided by Air Traffic Services on discrete frequencies at most attended aerodromes.
ATIS reports include runway in use, wind direction in degrees magnetic, wind speed in knots, visibility, including significant directional variations (if available RVR will be used when visibility is less than 1500), present weather (if significant), low cloud (if significant) (cloud height/base in feet above aerodrome level), temperature, dew point and QNH.
Additional items will also be included when available, such as reported turbulence; and reported or forecast wind at 2000 ft.
ATIS reports are for preflight and inflight use and are available from:
ATIS broadcast
IFIS(external link)
ATIS NZAA P 0020
APCH: ILS DME
RWY: 23 LEFT
RWY COND: DRY
OPR INFO: TWY A 8 CLSD.
WIND: 190/7KT
VIS: 20 KM
WX: HZ
CLD: SCT 3900 FT
TEMPERATURE: 25 DEW POINT: 15
QNH: 1016 HPA
SIGWX: COND SUITABLE FOR A VISUAL APCH.
2000 FT WIND: REP VRB/03KT
ON FIRST CTC WITH NZAA ATC NOTIFY RCPT OF P.
| Code | Decode |
| ATIS NZAA P 0020 | ATIS report for: NZAA (Auckland Airport). ATIS Code letter: P (Papa). Each new report is assigned the next letter in the phonetic alphabet, e.g., the next report would have the code letter Q (Quebec). Issue time: 0020 UTC |
| APCH: ILS DME | Type of approach available: ILS DME |
| RWY: 23 LEFT | Runway-in-use: 23 Left |
| RWY COND: DRY | Runway condition (COND): Dry |
| OPR INFO: TWY A 8 CLSD. | Operational (OPR) information: TWY A 8 CLSD (Taxiway A8 closed) |
| WIND: 190/7KT | Wind direction and speed: 190 degrees magnetic, 7 knots (KT) |
| VIS: 20 KM | Visibility: 20 kilometres (KM) |
| WX: HZ | Weather: Haze (HZ) |
| CLD: SCT 3900 FT | Cloud: Scattered (SCT) at 3,900 ft above aerodrome level |
| TEMPERATURE: 25 DEW POINT: 15 |
Temperature: 25 degrees C Dew Point: 15 degrees C |
| QNH: 1016 HPA | QNH: 1016 hectopascals (hPa) |
| SIGWX: COND SUITABLE FOR A VISUAL APCH | Significant weather: Conditions (COND) suitable for a visual approach (APCH) |
| 2000 FT WIND: REP VRB/03KT | 2000 FT WIND: Reported (REP) wind at 2,000 feet, variable in direction at 3 knots (KT) |
| ON FIRST CTC WITH NZAA ATC NOTIFY RCPT OF P | Contact instructions: On first contact (CTC) with NZAA ATC, notify receipt (RCPT) of ATIS report P (Papa) |
A Basic Weather Report (BWR) is a verbal comment on actual weather conditions at particular aerodromes. BWR are not an alternative to METAR, SPECI or METAR AUTO reports.
BWR are for preflight and inflight use.
Example
The Graphical Aviation Forecast (GRAFOR) is a chart depicting forecast weather information for low level flights (SFC to 10,000ft).
GRAFOR is for preflight use and is available from:
PreFlight(external link)
MetJet(external link)
IFIS(external link)
See the GRAFOR User Guide(external link) for detailed information on the GRAFOR, including a decoded example.
The Graphical New Zealand Significant Weather chart (GNZSIGWX) depicts forecast turbulence, mountain waves, CBs, airframe icing and volcanic activity in the New Zealand (NZZC) FIR. Three airspace options are provided including SFC-FL410, SFC-FL250 & SFC-FL100.
GNZSIGWX is for preflight use and is available from:
PreFlight(external link)
MetJet(external link)
IFIS(external link)
See the Graphical NZ SIGWX User Guide(external link) for detailed information on the GNZSIGWX, including a decoded example.
Meteorological data can be provided in GRIB (GRIdded Binary) format, for forecast variables such as wind, temperature and humidity, for a set of regularly spaced points. These are typically spaced at intervals of 1.25 degrees of latitude and longitude. Additional forecast data such as icing, turbulence and CB cloud is also available.
GRIB data is intended primarily for use in computer based flight planning systems, but it can also be used to produce wind and temperature charts.
GRIB data is for preflight use and is available from:
Aerodrome reports are provided for specific aerodromes and presented in the METAR (Meteorological Aerodrome Report), SPECI (Special Aerodrome Report) and METAR AUTO (Automated Meteorological Aerodrome Report) codes.
METAR and SPECI are reports provided by human observers, while METAR AUTO are provided from Automatic Weather Stations (AWS). SPECI AUTO are not provided.
METAR, SPECI and METAR AUTO are used for preflight and inflight and are available from:
PreFlight(external link)
MetJet(external link)
IFIS(external link)
Provided for NZWP, NZOH, NZMF only.
METAR NZMF 230200Z 33006KT 20KM -SHRA FEW015 SCT040 BKN050 10/08 Q1008
| Code | Decode |
| METAR NZMF 230200Z | Routine Meteorological Aerodrome Report for Milford aerodrome, at 0200 UTC on the 23rd of the month |
| 33006KT | Surface wind: 330 degrees true, 6 knots |
| 20KM | Visibility: 20 kilometres |
| SHRA | Present weather: light shower of rain |
| FEW015 SCT040 BKN050 |
Cloud: Few cloud (1-2 oktas) with a base of 1500 feet above aerodrome level, scattered cloud (3-4 oktas) with a base of 4000 feet above aerodrome level and broken cloud (5-7 oktas) with a base of 5,000 feet above aerodrome level |
| 10/08 | Temperature: 10 degrees Celsius; Dew Point: 8 degrees Celsius |
| Q1008 | QNH: 1008 hectopascals (hPa) |
Provided for NZWP, NZOH, NZMF only
SPECI NZWP 010010Z 03022G34KT 010V080 2000 –DZRA FEW003 BKN006
22/21 Q0997 RERA
| Code | Decode |
| SPECI NZWP | Special Meteorological Aerodrome Report for Whenuapai aerodrome, issued at 0010 UTC on the 1st of the month |
| 03022G34KT 010V080 | Surface wind: 030 degrees true, 22 knots gusting to 34 knots. Wind direction varying between 010 degrees true and 080 degrees true |
| 2000 | Visibility: 2000 metres |
| -DZRA | Weather: Light drizzle and rain at the time of the observation |
| FEW003 BKN006 | Cloud: Few cloud (1-2 oktas) with a base at 300 feet above aerodrome level, and broken cloud (5–7 oktas) with a base at 600 feet above aerodrome level |
| 22/21 | Temperature: 22 degrees Celsius Dew Point: 21 degrees Celsius |
| Q0997 | QNH: 997 hectopascals |
| RERA | Recent weather: Moderate or heavy rain has been observed at the aerodrome since the last routine report |
Detailed description of AWS sensors and METAR-AUTO [PDF 74 KB].
List of METAR AUTO AWS locations, including visibility and cloud range limitations, as at 10 Jan 2018:
| Location ID | Aerodrome (Listing in alphabetical order) | Visibility Range (km) | Cloud Range |
|
AA |
Auckland |
50 |
25,000 25,000 25,000 25,000 25,000 25,000 25,000 25,000 25,000 25,000 25,000 25,000 25,000 25,000 25,000 25,000 25,000 25,000 25,000 25,000 25,000 25,000 25,000 25,000 25,000 25,000 25,000 25,000 25,000 25,000 |
METAR NZNS 011400Z AUTO 35004KT 310V010 29KM -SHRA OVC048/// 19/16 Q1021
| Code | Decode |
| METAR NZNS 011400Z AUTO | Routine Meteorological Aerodrome Report for Nelson aerodrome, issued at 1400 UTC on the 1st of the month. Observation made by an Automatic Weather Station |
| 35004KT 310V010 | Surface wind: 350 degrees true, 4 knots. Wind direction varying between 310 degrees true and 010 degrees true |
| 29KM | Visibility: 29 kilometres |
| -SHRA | Weather: Light shower of rain |
| OVC048/// | Cloud: Overcast cloud (8 oktas) with a base at 4800 feet above aerodrome. The three strokes (///) indicate that no TCU or CB cloud could be identified by the Automatic Weather Station |
| 19/16 | Temperature: 19 degrees Celsius, Dew Point: 16 degrees Celsius |
| Q1021 | QNH: 1021 hectopascals |
METAR NZWN 162000Z AUTO 36016KT 9999 // BKN025/// 16/12 Q1028 RMK KAUKAU 36033KT
| Code | Decode |
| METAR NZWN 162000Z AUTO | Routine Meteorological Aerodrome Report for Wellington aerodrome, at 2000 UTC on the 16th of the month. Observation made by an Automatic Weather Station |
| 36016KT | Surface wind: 360 degrees true, 16 knots |
| 9999 | Visibility: 10 kilometres or more |
| // | Present weather: the present weather cannot be observed due to a temporary failure of the system/sensor |
| BKN025/// | Cloud: Broken cloud (5-7 oktas) with a base of 2500 feet above aerodrome level. The three strokes (///) indicate that no TCU or CB could be identified by the AWS |
| 16/12 | Temperature: 16 degrees Celsius; Dew point: 12 degrees Celsius |
| Q1028 | QNH: 1028 hectopascals (hPa) |
| RMK KAUKAU 36033KT | Wind at Mt Kaukau: 360 degrees true, 33 knots |
METAR NZAA 010000Z AUTO 03022G34KT 010V080 2000 R05/1300D -DZRA FEW003/// BKN006/// 22/21
| Code | Decode |
| METAR NZAA 010000Z AUTO | Routine Meteorological Aerodrome Report for Auckland aerodrome, at 0000 UTC on the 1st of the month. Observation made by an Automatic Weather Station |
| 03022G34KT | Surface wind: 030 degrees true, 22 knots, gusts to 34 knots |
| 010V080 | Surface wind direction: varying between 010 degrees true and 080 degrees true |
| 2000 | Visibility: 2000 metres |
| R05/1300D | Runway visual range: 1300 metres for the touchdown zone of runway 05, with a downward tendency observed |
| -DZRA | Present weather: light drizzle and rain |
| FEW003/// BKN006/// |
Cloud: Few cloud (1-2 oktas) with a base of 300 feet above aerodrome level, broken cloud (5-7 oktas) with a base of 600 feet above aerodrome level. The three strokes (///) at the end of both cloud groups indicate that no TCU or CB could be identified by the AWS |
| 22/21 | Temperature: 22 degrees Celsius; Dew point: 21 degrees Celsius |
| Q0997 | QNH: 997 hectopascals (hPa) |
Notes about METAR AUTO reports:
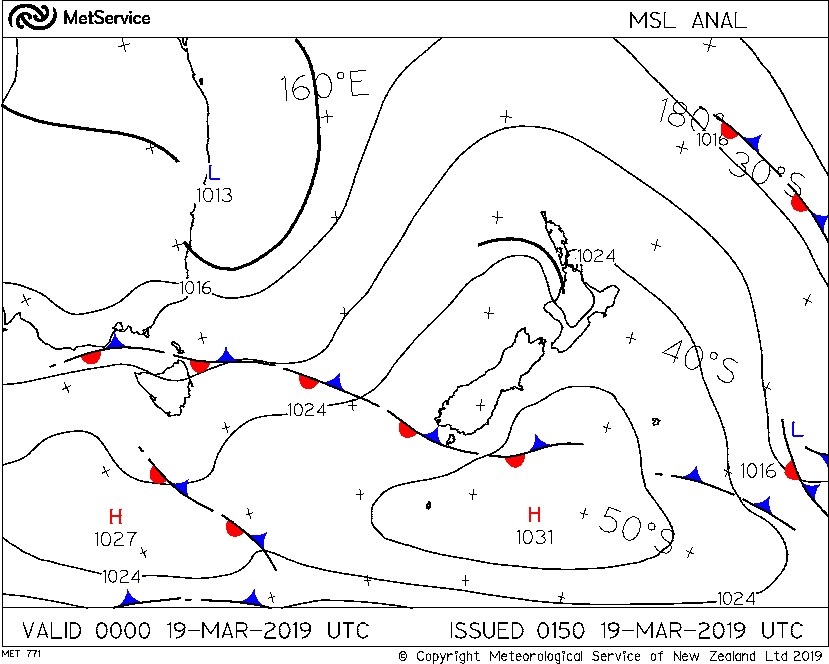
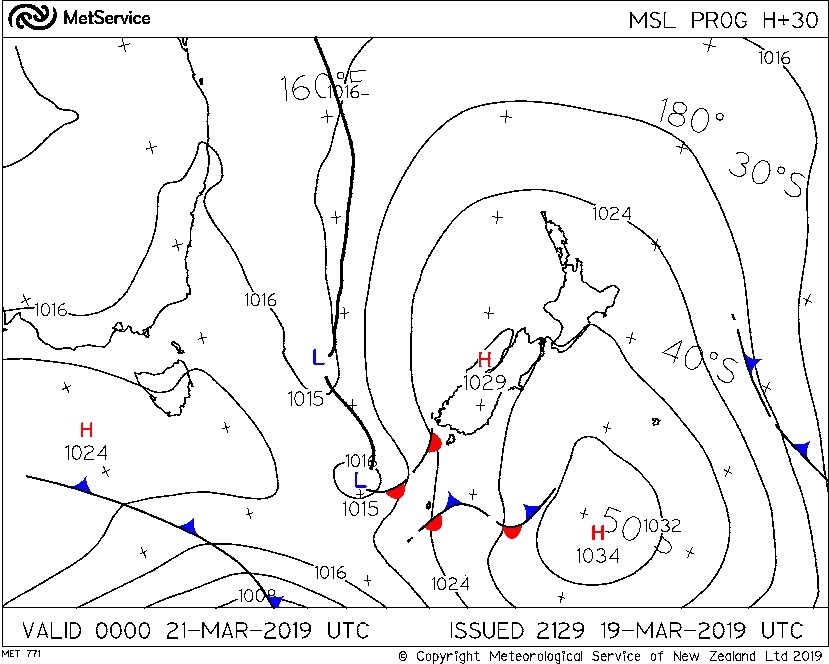
Mean Sea Level Analyses (MSL ANAL) and Mean Sea Level Prognoses (MSL PROG) are contour charts of the atmospheric pressure at mean sea level for a given time in the past (analysis) or for a given time in the future (prognosis).
MSL Charts are for preflight use and are available from:
PreFlight(external link)
MetJet(external link)
Example MSL ANAL
Example MSL PROG
A ROFOR is a route forecast of wind, temperature and significant weather for a specific route and flight levels.
ROFOR are for preflight use and are available from:
MetService(external link)
MetJet(external link)
| ROFOR VALID 102000/110600 | |||||
| ROUTE NZRO/NZCH | |||||
| ZONE | FL100 | FL180 | FL300 | FL340 | FL360 |
| NZRO/TM | 23006M03 | 25017M19 | 25054M45 | 25065M54 | 26062M56 |
| TM/MEVAX | 24004M03 | 24017M19 | 25055M46 | 25065M54 | 26063M56 |
| MEVAX/NS | 27003M03 | 24018M19 | 26060M46 | 26068M55 | 26063M57 |
| NS/PEAKS | 26006M03 | 25016M20 | 26048M48 | 26062M56 | 26060M57 |
| PEAKS/YW | 25008M03 | 24015M21 | 25040M49 | 26057M56 | 26055M57 |
| YW/NZCH | 25009M04 | 24015M21 | 25037M49 | 26053M56 | 26052M57 |
| Code | Decode |
| ROFOR VALID 102000/110600 | Route forecast valid from 2000 UTC on the 10th day of the month until 0600 UTC on the 11th day of the month |
| ROUTE NZRO/NZCH | Route: Rotorua to Christchurch |
| ZONE | This column lists the route (NZRO/NZCH) from waypoint to waypoint, eg, NZRO/TM is for that part of the route from Rotorua to waypoint TM |
| FL100 FL180 FL300 FL340 FL360 | These columns list the forecast winds and temperatures at FL100, FL180, FL300, FL340 and FL360, for each of the zones shown in the “Zone” column |
| 23006M03 |
The forecast winds and temperatures are shown in the following format:
Eg, in the Zone NZRO/TM, for FL100, the wind direction is 230 degrees true, wind speed 6 knots and temperature minus 3 degrees Celsius. Note: The winds and temperatures represent the average values for the zone concerned, eg, for the zone NZRO/TM, the winds and temperatures are the average between NZRO and TM. They are not the winds at NZRO and TM |
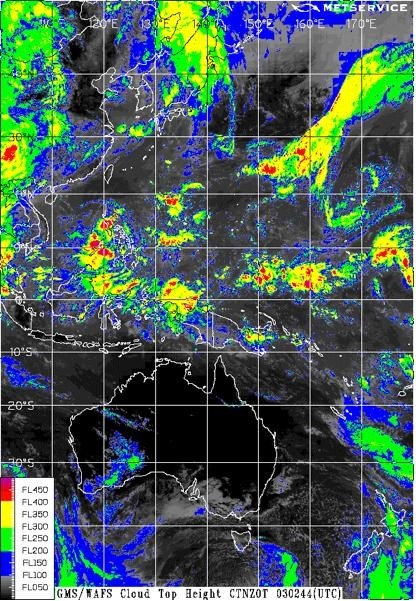
Satellite imagery over New Zealand is primarily obtained from the geostationary satellite Himawari-8, provided courtesy of the Japanese Meteorological Agency. Visible and infrared satellite images are available at a frequency of up to every 10 minutes and show the extent of cloud coverage in a disc centred on a longitude of 140.7° E. Additional satellite imagery can also be sourced from polar orbiting satellites, which orbit the Earth at a much lower altitude.
Satellite imagery is for pre-flight use and is available from:
PreFlight(external link)
MetJet(external link)
IFIS(external link)
By comparing the brightness temperature of the cloud with model atmospheric temperature profile data, cloud top heights can be inferred – colour coded by estimated flight level in the example below.
SIGMET (Significant Meteorological Information) provide information concerning the occurrence or expected occurrence of weather phenomena of a hazardous nature and which could affect the safety of aircraft in flight.
SIGMETs are produced in text format and are also displayed graphically on a Graphical SIGMET Monitor (GSM). Two GSMs are available – one for the NZZC FIR and one for the region of the NZZO FIR that is north of 70S. For SIGMETs south of 70S, only text SIGMETs are available.
SIGMETs and the GSMs are for both preflight and inflight use and are available from:
PreFlight(external link)
MetJet(external link)
IFIS(external link)
ATIS broadcast
WSNZ21 NZKL 140010 NZZC SIGMET 1 VALID 140010/140410 NZKL-
NZZC NEW ZEALAND FIR SEV ICE FCST N OF S3958 E17502 AND S OF S3516 E17355 FL120/250 MOV S 20KT NC
| Code | Decode |
| WSNZ21 NZKL 140010 | WMO meteorological message header (WSNZ21), issued by the Wellington Meteorological Watch Office (NZKL) at 0010UTC on the 14th day of the month. The message header (WSNZ21) can be ignored by pilots |
| NZZC | Issued for the Christchurch Flight Information Centre |
| SIGMET | SIGnificant METeorological information for pilots (a message containing information about hazardous weather) |
| 1 | The 1st SIGMET issued on the 14th day of the month since 0000UTC |
| VALID 140010/140410 | Valid between 0010 and 0410 UTC on the 14th day of the month |
| NZKL- | Issued by the Wellington Meteorological Watch Office (MWO), Kelburn, Wellington. The "-" sign indicates the end of the 1st line of the message |
| NZZC NEW ZEALAND FIR | Issued for the New Zealand Flight Information Region. (NZZC) |
| SEV ICE FCST N OF S3958 E17502 AND S OF S3516 E17355 FL120/250 MOV S 20KT NC | Severe icing is forecast north of latitude 39 degrees 58 minutes south, 175 degrees 02 minutes east (ie Wanganui – NZWU) and south of latitude 35 degrees 16 minutes south, longitude 173 degrees 55 east (ie Kerikeri – NZKK), between flight level 120 and flight level 250, moving south at 20 knots |
| NC | Intensity not expected to change (NC = no change) |
A STATUS indicator may be included after the name of the FIR. Used only when the message issued to indicate that a test or an exercise is taking place. When the word “TEST” or the abbreviation “EXER” is included, the message may contain information that should not be used operationally or will otherwise end immediately after the word “TEST”.
See the GSM User Guide [PDF 2.1 MB] for more detailed information on the graphical display of SIGMETs.
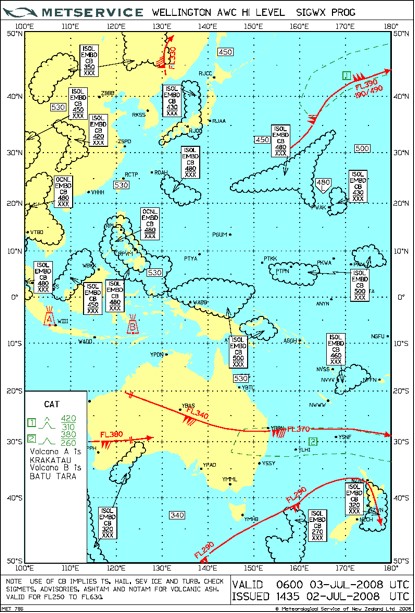
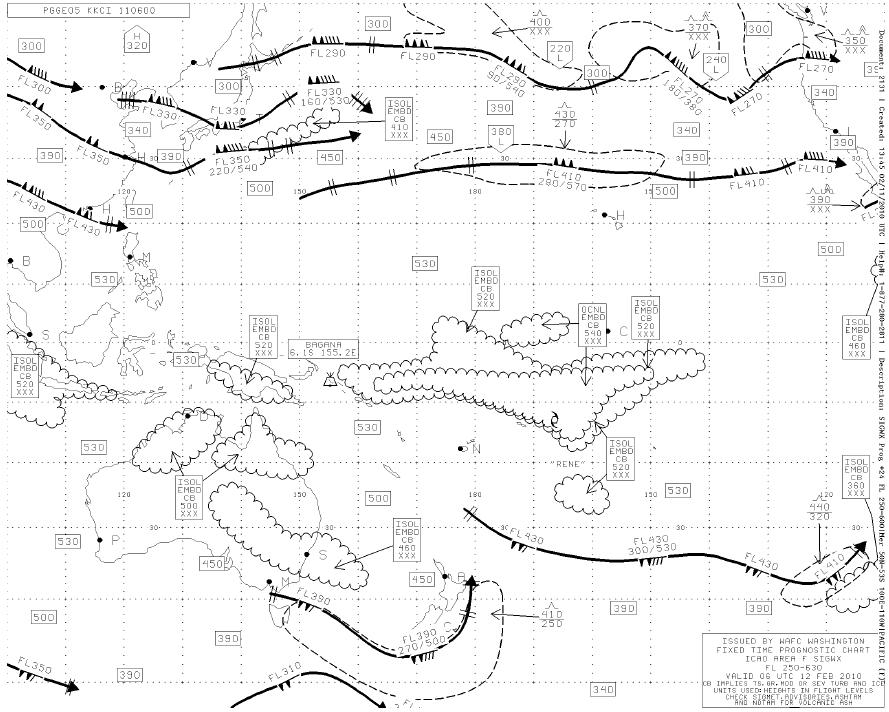
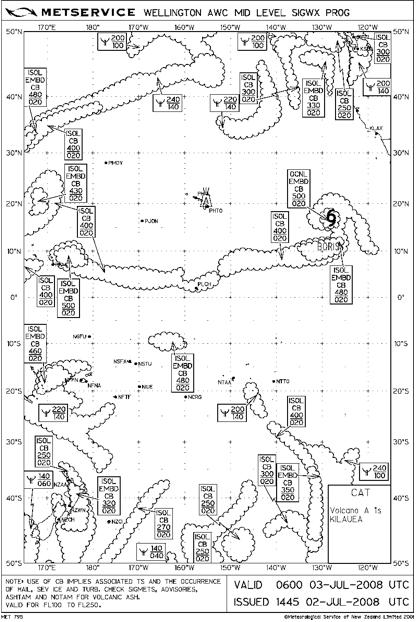
Significant Weather (SIGWX) forecasts are provided for the airspace between FL100 and FL250 (medium or mid-level SIGWX) and between FL250 and FL630 (high-level SIGWX). The forecasts are normally issued in chart form for specific geographical areas.
High-level SIGWX charts are produced by the two World Area Forecast Centres (WAFCs), with the Washington WAFC being the primary provider for NZ use, and London WAFC as the backup.
Mid-level SIGWX charts are produced by MetService and are based primarily on the Washington WAFC high-level SIGWX charts for the same validity time, with London WAFC charts used in backup situations.
SIGWX forecasts are for preflight use and are available from:
MetService(external link)
MetJet(external link)
Hi-Level SIGWX Chart – colour customised version
Hi-Level SIGWX Chart – black and white ICAO standard version
Medium (Mid) Level SIGWX Chart
SWX advisories* provide information on the expected effects of particular types of solar disturbances.
*Issued as necessary from 7 Nov 2019
SWX advisories are for both pre-flight and in-flight use and are available from:
Domestic TAFs are aerodrome forecasts provided for specific aerodromes and presented in the Terminal Aerodrome Forecast (TAF) code. They differ from International TAFs in that visibilities above 10km are included, as are cloud groups above 1500 ft. Winds at 2000 ft AGL and forecast QNH at the aerodrome are added at the end of the TAF.
The QNH forecast is for the maximum and minimum QNH values expected during the validity period of the TAF, or during a specified validity period. The forecast is provided as a guide to the range of pressure expected during a TAF or specified validity period. The main purpose is to provide a check on the actual QNH passed to an aircraft to ensure that any errors in transmission do not result in an incorrect altimeter setting. The QNH forecasts, appended to Domestic TAF, shall not be used for altimeter setting.
A forecast 2,000 ft wind is included to assist in determining the possibility of wind shear between 2,000 ft and the ground level.
Domestic TAFs are for both preflight and inflight use and are available from:
PreFlight(external link)
MetJet(external link)
IFIS(external link)
TAF NZRO 192313Z 2000/2012 01015G28KT 30KM -SHRA SCT020 BKN035
TEMPO 2001/2004 5000 +TSRAGS BKN010CB
2000FT WIND 36020KT
QNH MNM 1015 MAX 1024
| Code | Decode |
| TAF NZRO 192313Z 2000/2012 | Aerodrome forecast for Rotorua, issued at 2313 UTC on the 19th of the month, valid from 0000 UTC to 1200 UTC on the 20th of the month |
| 01015G28KT | Surface wind: 010 degrees true, 15 knots gusts 28 knots |
| 30KM | Visibility: 30 kilometres |
| -SHRA | Weather: Light shower of rain |
| SCT020 BKN035 | Cloud: scattered cloud (3-4 oktas) with a base at 2000 feet above aerodrome level, broken cloud (5-7 oktas) with a base at 3500 feet above aerodrome level |
| TEMPO 2001/2004 5000 +TSRAGS BKN010CB |
Temporarily, between 0100 and 0400 UTC on the 20th of the month, visibility will reduce to 5000 metres in heavy thunderstorms with rain and hail, and broken cumulonimbus cloud at 1000 feet above aerodrome level |
| 2000FT WIND 36020KT | Forecast wind at 2000 feet 360 degrees true at 20 knots |
| QNH MNM 1015 MAX 1024 | The minimum and maximum QNH during the forecast period is expected to be 1015 hPa and 1024 hPa respectively |
International TAFs are aerodrome forecasts provided for specific aerodromes and presented in the Terminal Aerodrome Forecast (TAF) code. They differ from Domestic TAFs in that they are in Annex 3 format where visibilities at or above 10 km and non-significant cloud groups are not included. Winds at 2000ft and forecast QNH are also not included.
International TAFs are only issued for NZAA, NZWN & NZCH.
International TAFs are for both preflight and inflight use and are available from:
PreFlight(external link)
MetJet(external link)
IFIS(external link)
TAF NZCH 102305Z 1100/1206 20008KT 9999 FEW012 SCT017
TEMPO 1100/1108 BKN012
BECMG 1108/1110 06010KT
TEMPO 1108/1121 6000 DZ BKN012
TEMPO 1121/1206 4000 RA BKN009
| Code | Decode |
| TAF NZCH 102305Z 1100/1206 | Aerodrome forecast for Christchurch International Airport, issued at 2305 UTC on the 10th of the month, valid from 0000 UTC on the 11th of the month to 0600 UTC on the 12th of the month |
| 20008KT | Surface wind: 200 degrees true, 8 knots |
| 9999 | Visibility: 10 kilometres or more |
| FEW012 SCT017 | Cloud: few cloud (1-2 oktas) with a base at 1200 feet above aerodrome level, scattered cloud (3-4 oktas) with a base at 1700 feet above aerodrome level |
| TEMPO 1100/1108 BKN012 | Temporarily, between 0000 and 0800 UTC on the 11th, broken cloud (5-7 oktas) with a base of 1200 feet above aerodrome level |
| BECMG 1108/1110 06010KT | Becoming, between 0800 and 1000 UTC on the 11th, wind 060 degrees true, 10 knots |
| TEMPO 1108/1121 6000 DZ BKN012 | Temporarily, between 0800 and 2100 UTC on the 11th, visibility will reduce to 6000 metres in drizzle, with broken cloud (5-7 oktas) at 1200 feet above aerodrome level |
| TEMPO 1121/1206 4000 RA BKN009 | Temporarily, between 2100 UTC on the 11th and 0600 UTC on the 12th, visibility will reduce to 4000 metres in rain, with broken cloud (5-7 oktas) at 900 feet above aerodrome level |
TC advisories provide information on the position, forecast direction and speed of movement, central pressure and maximum surface wind of tropical cyclones.
TC advisories are for both pre-flight and in-flight use and are available from:
MetJet(external link)
Fiji Meteorological Service(external link)
FKPS02 NFFN 041916
TC ADVISORY
DTG: 20190104/1800Z
TCAC: NFFN
TC: GLORIA
ADVISORY NR: 2019/09
OBS PSN: 04/1800Z S1336 E17536
CB: WI 250NM OF TC CENTRE TOP FL500
MOV: NNW 05KT
C: 985HPA
MAX WIND: 50KT
FCST PSN +6 HR: 05/0000Z S1330 E17548
FCST MAX WIND +6 HR: 50KT
FCST PSN +12 HR: 05/0600Z S1330 E17606
FCST MAX WIND +12 HR: 50KT
FCST PSN +18 HR: 05/1200Z S1342 E17636
FCST MAX WIND +18 HR: 50KT
FCST PSN +24 HR: 05/1800Z S1406 E17712
FCST MAX WIND +24 HR: 50KT
RMK: NIL
NXT MSG: 20190105/0100Z
|
|
FKPS02 NFFN 041916 |
WMO Header (FKXXii, WMO location indicator of TCAC, UTC date-time of issue of the message). The message header can be ignored by pilots. |
|
1 |
TC ADVISORY |
Type of message (Tropical Cyclone Advisory) |
|
2 |
STATUS (conditional – may not be included*) |
STATUS indicator only included if needed - either test (TEST) or exercise (EXER). If not included, then message is operational. |
|
3 |
DTG: 20190104/1800Z |
Time of origin: Date and time in UTC of message issue (yyyymmdd/nnnnZ) – 1800Z 4 January 2019. |
|
4 |
TCAC: NFFN |
Name of Tropical Cyclone Advisory Centre issuing the product (location indicator or full name) – NFFN or Nadi. |
|
5 |
TC: GLORIA |
Name of tropical cyclone (or NN for unnamed tropical cyclone) |
|
6 |
ADVISORY NR: |
Year in full and message number (separate sequence for each cyclone) – 9th advisory for TC GLORIA in 2019. |
|
7 |
OBS PSN: |
Day and time in UTC and position of the centre of the tropical cyclone (in degrees and minutes) – at 1800Z on the 4th of the month, the TC was observed at position S1336 E17536 |
|
8 |
CB: (conditional – may not be included) |
Location of CB cloud (referring to latitude and longitude (in degrees and minutes)) and vertical extent (flight level). CB are observed within 250NM of the TC centre, with CB tops at FL500. |
|
9 |
MOV: |
Direction and speed of movement given in sixteen compass points and km/h (or kt), respectively, or stationary (< 2 km/h (1 kt)). The TC is moving to the north-northwest, at a speed of 5 knots. |
|
10 |
C: |
Central pressure (in hPa) – in this case, a central pressure of 985 hectopascals. |
|
11 |
MAX WIND: |
Maximum surface wind near the centre (mean over 10 minutes, in m/s (or kt)) – 50KT in this example. |
|
12 |
FCST PSN +6 HR: |
Day and time (in UTC) (6 hours from the “DTG” given in Item 3); Forecast position (in degrees and minutes) of the centre of the tropical cyclone |
|
13 |
FCST MAX WIND +6 HR: |
Forecast of maximum surface wind (6 hours after the “DTG” given in Item 3) |
|
14 |
FCST PSN +12 HR: |
Day and time (in UTC) (12 hours from the “DTG” given in Item 3); Forecast position (in degrees and minutes) of the centre of the tropical cyclone |
|
15 |
FCST MAX WIND +12 HR: |
Forecast of maximum surface wind (12 hours after the “DTG” given in Item 3) |
|
16 |
FCST PSN +18 HR: |
Day and time (in UTC) (18 hours from the “DTG” given in Item 3); Forecast position (in degrees and minutes) of the centre of the tropical cyclone |
|
17 |
FCST MAX WIND +18 HR: |
Forecast of maximum surface wind (18 hours after the “DTG” given in Item 3) |
|
18 |
FCST PSN +24 HR: |
Day and time (in UTC) (24 hours from the “DTG” given in Item 3); Forecast position (in degrees and minutes) of the centre of the tropical cyclone |
|
19 |
FCST MAX WIND +24 HR: |
Forecast of maximum surface wind (24 hours after the “DTG” given in Item 3) |
|
20 |
RMK: |
Remarks, as necessary. In this case, there were NIL remarks provided. |
|
21 |
NXT MSG: |
Expected year, month, day and time (in UTC) of issuance of next advisory – in this case the next advisory is expected to be issued at 0100Z on the 5th January 2019. |
* Used only when the message issued to indicate that a test or an exercise is taking place. When the word “TEST” or the abbreviation “EXER” is included, the message may contain information that should not be used operationally or will otherwise end immediately after the word “TEST”.
The Volcanic Ash Advisory (VAA) provides information in text form about ash in the atmosphere resulting from volcanic eruptions. This information is also provided graphically as a Volcanic Ash Graphic (VAG).
For detailed information on the NZ Volcanic Ash Advisory System, please see Living with Volcanic Ash [PDF 1.4 MB].
VAAs and VAGs are for both preflight and inflight use and are available from:
PreFlight(external link)
MetJet(external link)
IFIS(external link)
VAAC Wellington(external link)
FVPS04 NZKL 250243
VA ADVISORY
DTG: 20171025/0243Z
VAAC: WELLINGTON
VOLCANO: RUAPEHU 241100
PSN: S3917 E17534
AREA: NEW ZEALAND
SUMMIT ELEV: 2797M
ADVISORY NR: 2017/3
INFO SOURCE: WEBCAM, SATELLITE IMAGERY, GNS
AVIATION COLOUR CODE: RED
ERUPTION DETAILS: ERUPTION AT 20171025/0210Z
OBS VA DTG: 25/0233Z
OBS VA CLD: SFC/FL210 S3815 E17615 - S3815 E17700 - S3900 E17700 - S3915 E17530 - S3815 E17615 MOV N 5KT
FCST VA CLD +6 HR: 25/0833Z SFC/FL210 S3730 E17800 - S3815 E17815 - S3900 E17715 - S3915 E17530 - S3730 E17700 - S3730 E17800
FCST VA CLD +12 HR: 25/1433Z SFC/FL210 S3915 E17545 - S3915 E17530 - S3730 E17700 - S3715 E17815 - S3730 E17915 - S3815 E17900 - S3845 E17730 - S3915 E17545
FCST VA CLD +18 HR: 25/2033Z SFC/FL150 S3915 E17545 - S3915 E17530 - S3745 E17730 - S3815 E17815 - S3900 E17745 - S3915 E17545 FL150/210 S3915 E17530 - S3645 E17615 - S3630 E17730 - S3730 E17800 - S3915 E17530
RMK: VA PARTIALLY OBSCURED BY MET CLOUD ALONG SOUTHERN BOUNDARY. VA HEIGHT AND FORECAST MOVEMENT BASED ON HIMAWARI-8 IMAGERY, NZPP 25/0000Z SOUNDING AND MODEL GUIDANCE.
NXT ADVISORY: NO LATER THAN 20171025/0843Z=
| FVPS01 NZKL 250243Z | WMO meteorological message header (FVPS01), issued by the Wellington Meteorological Office (NZKL) at 0243 UTC on the 25th day of the month. The message header (FVPS01) can be ignored by pilots. |
| VA Advisory | Type of message (Volcanic Ash Advisory). |
| DTG: 20171025/0243Z | DTG (Date, time group): Date and time of the VAA message (yyyymmdd/nnnnZ)(2017, October, 25th/0243 UTC). |
| VAAC: Wellington | Name of the Volcanic Ash Advisory Centre (Wellington) issuing the advisory. |
| VOLCANO: RUAPEHU 241100 | Name of the volcano (Ruapehu) and its international number (241100). |
| PSN: S3917 E17534 | Position (PSN), i.e. location, of the volcano in degrees and minutes (South 39 deg 17 min, East 175 deg 34 min). |
| AREA: NEW ZEALAND | Country, region or area in which the volcano is located (New Zealand). |
| SUMMIT ELEV: 2797M | Summit elevation of the volcano (2797 metres). |
| ADVISORY NR: 2017/3 | Advisory (or reference) number concerning the volcano. 2017/3 indicates it is the third advisory to be issued for the current activity of this volcano in 2017. |
| INFO SOURCE: WEBCAM, SATELLITE IMAGERY, GNS | Source of the information about the volcano and ash. The observation (OBS) is based of webcam and satellite images and from information provided by GNS Science, who operate the New Zealand volcano observatory. |
| AVIATION COLOUR CODE: RED | The aviation colour code is RED, see Living with Volcanic Ash [PDF 1.4 MB] in civil aviation for a description of the colour codes. |
| ERUPTION DETAILS: ERUPTION AT 20171025/0210Z | This indicates that an eruption of Mt Ruapehu occurred at 0210 UTC, 25 October 2017. |
| OBS VA DTG: 25/0233Z | Date and time (DTG) the volcanic ash was observed (25th day of the month, 0233 UTC). |
| OBS VA CLD: SFC/FL210 S3815 E17615 - S3815 E17700 - S3900 E17700 - S3915 E17530 - S3815 E17615 MOV N 5KT | Horizontal and vertical extent of the observed ash (as at 0233 UTC, 25th day of the month). Vertical extent - between the surface and FL210. Horizontal extent - the area is defined by a series of latitude and longitude points (degrees and minutes). The ash is estimated to be moving north at 5 kt. |
| FCST VA CLD +6 HR: 25/0833Z SFC/FL210 S3730 E17800 - S3815 E17815 - S3900 E17715 - S3915 E17530 - S3730 E17700 - S3730 E17800 |
A 6 hr forecast of the position of the ash cloud (vertical and horizontal extent) with the date and time of the forecast indicated (25th day of the month at 0833 UTC). |
| FCST VA CLD +12 HR: 25/1433Z SFC/FL210 S3915 E17545 - S3915 E17530 - S3730 E17700 - S3715 E17815 - S3730 E17915 - S3815 E17900 - S3845 E17730 - S3915 E17545 | A 12 hr forecast of the position of the ash cloud (vertical and horizontal extent) with the date and time of the forecast indicated (25th day of the month at 1433 UTC). Vertical extent – surface to FL210. Horizontal extent – the area is defined by a series of latitude and longitude points (degrees and minutes). |
| FCST VA CLD +18 HR: 25/2033Z SFC/FL150 S3915 E17545 - S3915 E17530 - S3745 E17730 - S3815 E17815 - S3900 E17745 - S3915 E17545 FL150/210 S3915 E17530 - S3645 E17615 - S3630 E17730 - S3730 E17800 - S3915 E17530 | An 18 hr forecast of the position of the ash cloud (vertical and horizontal extent) with the date and time of the forecast indicated (25th day of the month at 2033 UTC). Vertical extent – surface to FL150. Horizontal extent – the area is defined by a series of latitude and longitude points (degrees and minutes). An additional layer of ash cloud is also indicated with the vertical extent from FL150 to FL210. The area is defined by a series of latitude and longitude points (degrees and minutes). |
| RMK: VA PARTIALLY OBSCURED BY MET CLOUD ALONG SOUTHERN BOUNDARY. VA HEIGHT AND FORECAST MOVEMENT BASED ON HIMAWARI-8 IMAGERY, NZPP 25/0000Z SOUNDING AND MODEL GUIDANCE. |
Remark (RMK). This indicates that the volcanic ash (VA) is partially obscured by meteorological (MET) cloud along the southern boundary of the ash cloud. It also notes that the height and forecast movement of the ash cloud is based on; - imagery from the Himawari-8 weather satellite (operated by Japan); - the upper air sounding conducted at the Paraparaumu meteorological observatory at 0000 UTC, 25th day of the month; and - guidance from meteorological models. |
| NXT ADVISORY: NO LATER THAN 20171025/0843Z= | The next (NXT) advisory will be issued no later than 0843 UTC, 25 October, 2017. The end of message indicator (=) is also shown |
A STATUS indicator may be included after the line “VA Advisory”. It is used only when the message issued to indicate that a test or an exercise is taking place. When the word “TEST” or the abbreviation “EXER” is included, the message may contain information that should not be used operationally or will otherwise end immediately after the word "TEST".
A VAG is presented as a 4-panel map displaying volcanic ash observed from an aircraft, satellite image, webcam or other means, as well as the forecast location of the ash at 6, 12 and 18 hours after the time the ash was observed. The ash is displayed in areas (polygons) for up to four different layers, with the top and bottom of each layer included, e.g., SFC/FL100 indicates the layer extends from the surface to FL100. The boundary of the first polygon is depicted with solid lines, the next highest layer by dashed lines, the third layer by dotted lines and the fourth layer by combined dashed and dotted lines.
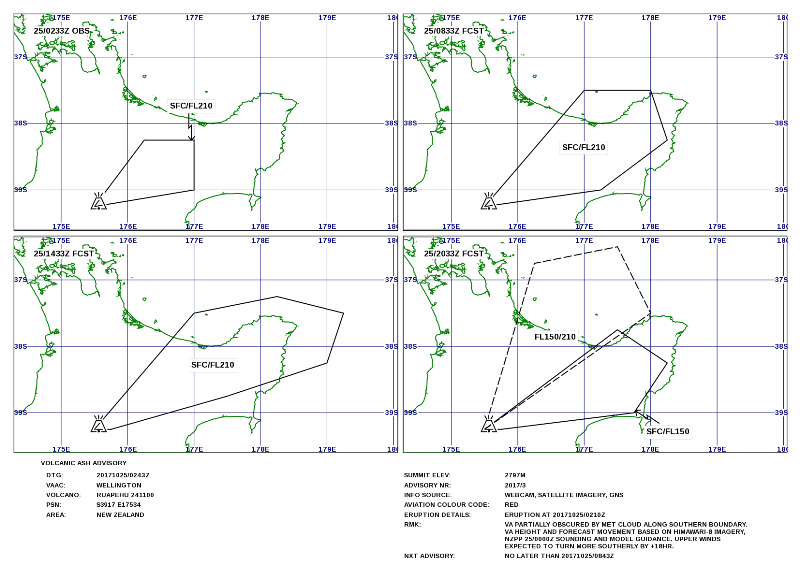
| Top left panel Depicts observed (OBS) ash at the time and date displayed, eg, 25/0232Z OBS means the ash displayed was observed at 0232 UTC on the 25th day of the month. The vertical extent of the ash is also shown, eg, SFC/FL210 means from the surface to FL210. |
Top right panel Depicts the expected (forecast) location of the ash 6 hours after the time of the observed ash, eg, 25/0833Z FCST means the forecast location of the ash at 0833 UTC on the 25th day of the month. The vertical extent of the ash is also shown, eg, SFC/FL210. |
| Bottom left panel Depicts the expected (forecast) location of the ash 12 hours after the time of the observed ash, eg, 25/1433Z FCST means the forecast location of the ash at 1433 UTC on the 25th day of the month. The verical extent of the ash is also shown, eg, SFC/FL210. |
Bottom right panel Depicts the expected (forecast) location of the ash 18 hours after the time of the observed ash, eg, 25/2033Z FCST means the forecast location of the ash at 2033 UTC on the 25th day of the month. Note that two separate layers of ash are displayed. The vertical extent of the two layers is also shown, eg, SFC/FL150 and FL150/210 respectively. |
Notes:
Routine broadcasts of selected OPMET. Broadcasts are made from Auckland (Auckland VOLMET) using discrete HF ground to air frequencies.
Regular broadcasts are made, as below:
| Name of Station | Frequency (kHz) | Broadcast Period | Hours of Service | Aerodromes Included | Contents and Format of Reports and Forecasts |
| Auckland | 6679 8828 13282 |
H+20-25 | H24 | Auckland Christchurch Wellington Nadi Faleolo* Noumea Rarotonga* Tahiti |
METAR/METAR AUTO**, SPECI, TREND |
| Nadi Noumea |
TAF | ||||
| Auckland | 6679 8828 13282 |
H+50-55 | H24 | Auckland Christchurch Wellington Nadi Faleolo* Noumea Pago Pago* Tahiti |
METAR/METAR AUTO**, SPECI, TREND |
| Auckland Christchurch |
TAF |
* No TREND
** METAR AUTO reports – Auckland, Wellington, Christchurch, Noumea and Rarotonga
VOLMET broadcasts do not exceed five minutes. Cloud types, except CB are not included. Reference to the need to amend the current TAF will not be included in VOLMET TREND forecasts. As a result of automation, the VOLMET will not include METAR remarks or recent weather.
Weather radar provides an image of precipitation detected within the surveillance cone of the radar. Weather radar can infer precipitation intensity (with some limitations) and location from the strength of the echo, the time taken for it to return, and the location from which it came. Radar imagery is available at 7.5 minute intervals, as this is the time it takes for the radar to complete one complete rotation.
There are nine weather radars in New Zealand located in Northland, Auckland, Bay of Plenty, Taranaki, Gisborne/Hawkes Bay, Wellington, Canterbury, Westland and Southland.
Radar imagery is for preflight use and is available from:
PreFlight(external link)
MetJet(external link)
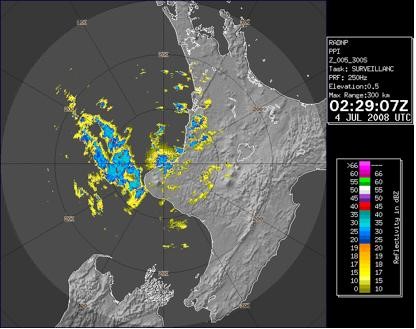
The intensity of the precipitation is indicated by the colour code on the right hand side of the picture. Colours towards the bottom of the scale indicate light intensity precipitation; moderate intensity near the middle of the scale, and heavy intensity towards the top of the scale. The fuzzy yellow area in the immediate vicinity of the radar site (at the crosshairs of the display) is caused by sea clutter (the radar signal close to the radar station bouncing off the sea).
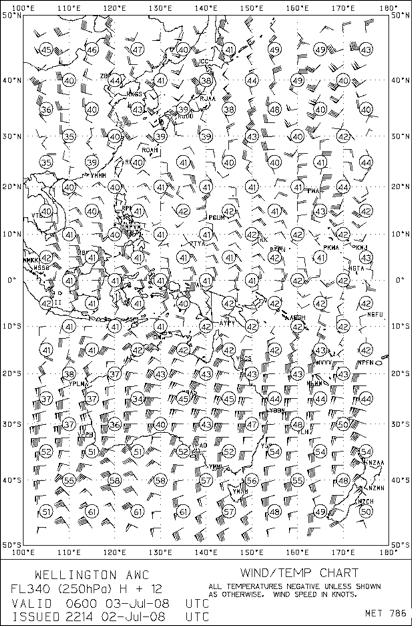
Wind and temperature forecasts are issued in chart form for specific times and levels. Wind direction and speed are indicated at selected points by wind arrows with feathers and shaded pennants, and spot temperatures are enclosed in circles.
Wind and temperature charts are for preflight use and are available from:
MetService(external link)
MetJet(external link)
If you have any questions about this topic, use our contact form, or email met@caa.govt.nz